This experiment designed to examine the properties of sound wave.
Procedure
1.

Labpro and microphone setup
2. One person say "AAAAAAAAA" -> collect data (graph will appear automatically)
3. Another person say "AAAAAAAA" -> collect data (also, graph will appear)
4. Collect data for a tuning fork by striking it on a soft object. (normal)
5. Collect another set of data for a tuning fork for a sound that is not as loud as #4.
Data
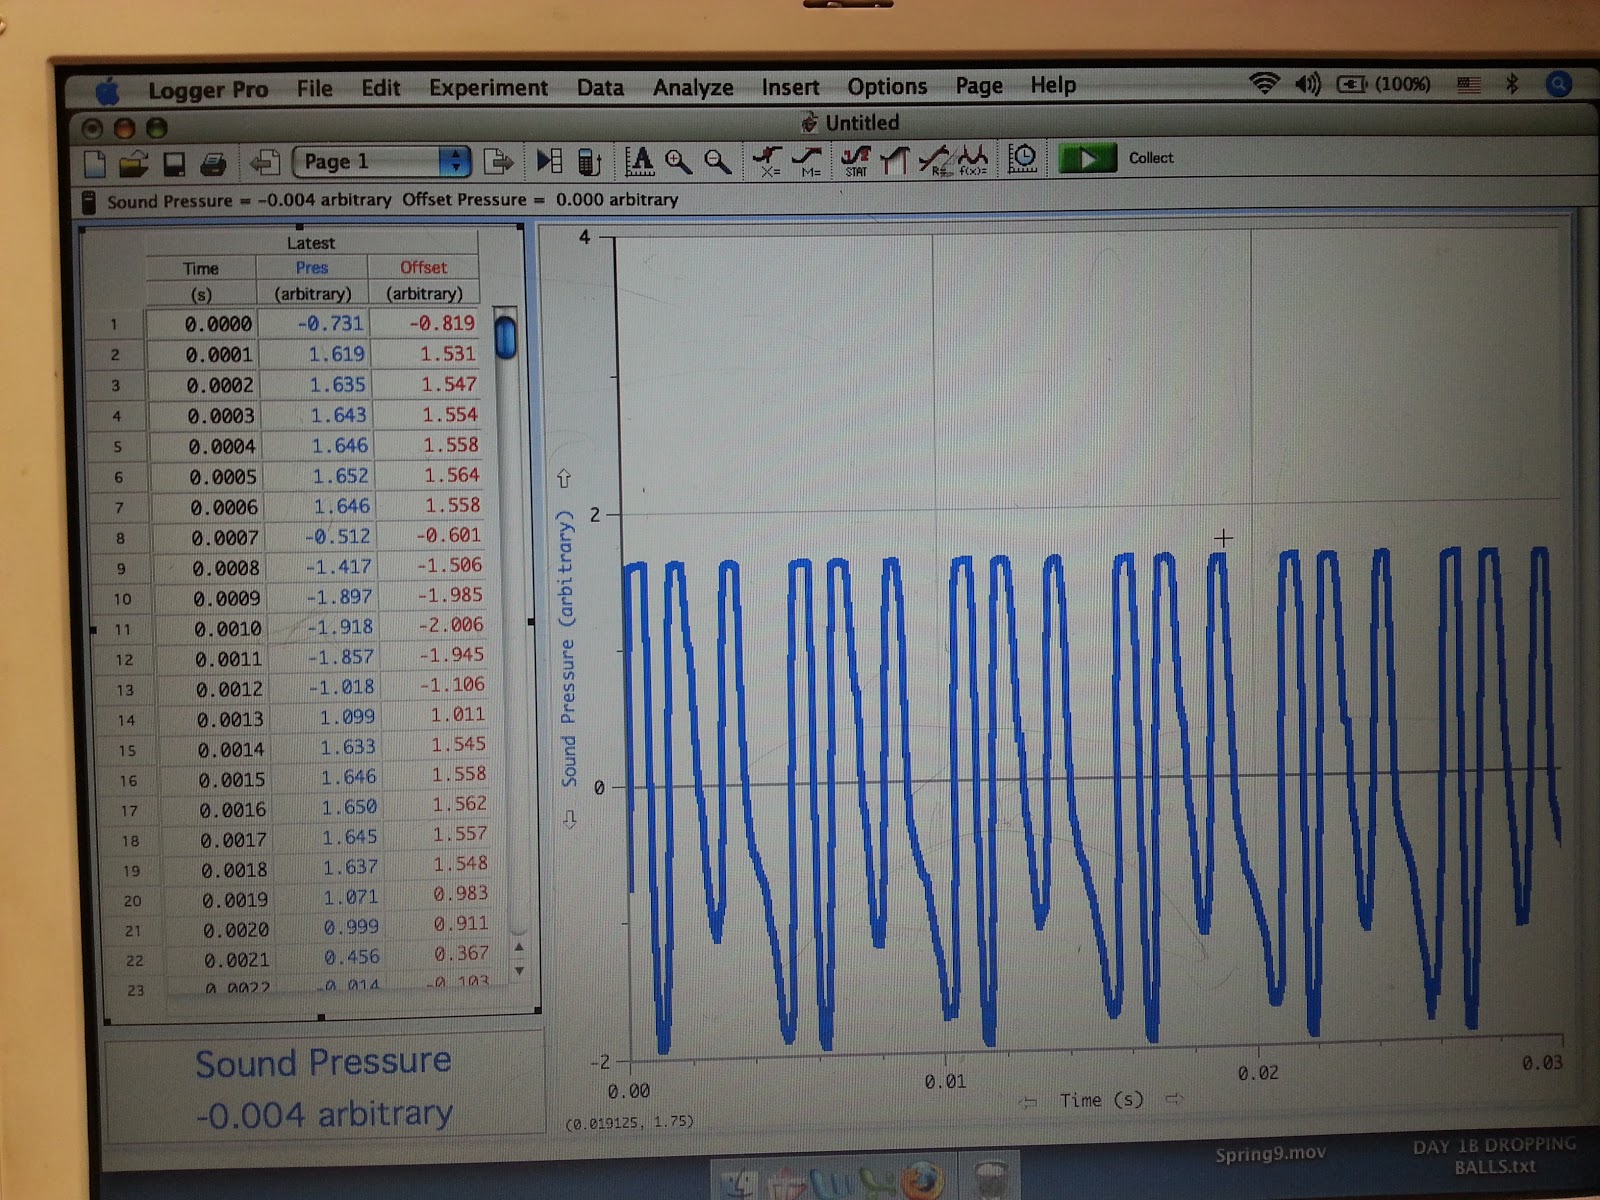
Graph #1

Graph #2

Graph #3

Graph #4
Discussion

C) blinking eye


Increase the sample 10 times long


Conclusion
It was difficult to get a steady wave curve by using human voice. As shown on our graph #1 and #2, the amplitude kept changing. However, the graph created by human voice are a periodic curve which same patterns of peaks were repeated periodically.
No comments:
Post a Comment