Wednesday, May 29, 2013

Lab 16. Planck's Constant rom an LED

Introduction
     In this experiment, the known value of Planck's constant was calculated from experimental measurement using different colors of LEDs.

Procedure 
Circuit was built similar to above scheme. 


Different LED light bulbs were used: yellow and blue
Green and Red LED lights

Data/Discussion


Summary
     Since the white LED light appeared as multiple color bands on its spectrum, the white LED have a mixture of colors. The wavelength and voltage is inversely proportional to each other. The graph that plotted voltage vs. 1/wavelength gave the relationship of y = 2187.7x -1.341. The slope represents for hc/E.The percent error of this experiment is about 1.75%. This suggested that the experimental procedure is consistent, which resulted in accurate planck's constant, h. 

Tuesday, May 28, 2013

Lab 15. Color and Spectra

Introduction
      In this experiment, we measured the wavelength of spectrum that created by white light and colored lights. 

Procedure

PART 1. The spectrum of White Light 
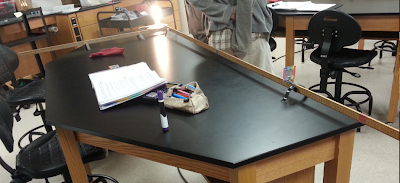
Experimental set up.
Spectrum observed through grating. 

Distance of violet and red band from the light source were measured. 

PART 2. Spectra of Hydrogen Gas
Light source is replaced with hydrogen gas tube. 
Measure the distance of 4 primary lines of hydrogen spectrum appeared from the light source (Blue, Green, Yellow, and Red)

Data/Discussion

PART 1. Spectrum of White Light
Distance of violet and red band from the white light source, and the wavelength was calculated. 
Calibration. The equation was derived by comparing the experimental values and theoretical values. 

The violet was closest to the light bulb and red color is the furthest from the light bulb. The color bands were appeared in order of inverse rainbow color: violet, blue, green, yellow, orange, red. 

PART 2. Spectra of a Hydrogen Gas
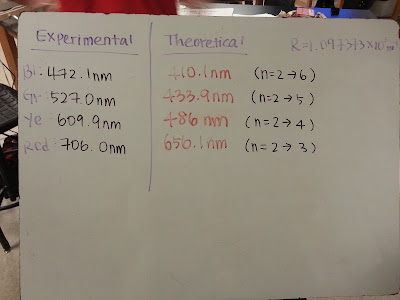
Distance of light bands were measured and wavelength was calculated. 
Using the relationship of calibration that obtained from part 1, the adjusted wavelength was obtained. 
The % Error was calculated by comparing experimental values to theoretical values. The blue band has 15% error, green band has 21.5% error, yellow band has 25.5% error, and red band has 7.6% error. 
Uncertainty of measurement was not considered as a single factor, because the experimental values were averaged 2 or 3 different trials together. 

Summary
     The spectrum that created by different light source was different in terms of color of bands, width of bands, and number of colors on spectrum. The white light showed continuous rainbow color spectrum while the hydrogen tube showed only 4 colors and very thin bands on its spectrum. 


Monday, May 27, 2013

Lab 13. Relativity of Time and Length

PART 1. Time Dilution

1. 

Answer : The distance traveled by the light pulse on the moving light clock is longer than the distance traveled by the light pulse on the stationary light clock.

2. 

Answer : The time interval for the light pulse on the moving light clock is longer than the stationary light clock.

3. 
Answer : The light pulse traveled a larger distance when the clock is moving. The moving time frame required same time interval to stationary frame. 

4. 

Answer : There will be no difference in light pulse travel time. They always stayed same. 

5. 
Answer :The light will take about 8 us to travel back and forth between mirrors.

6. 
Answer : The Lorentz factor will be 1.124.

PART 2. Length Contraction

1. 
Answer : The measurement of this round-trip time interval does not depend on whether the light clock is moving or stationary relative to the earth. 

2. 
Answer : The round-trip time interval for the light pulse as measured on the earth be longer than the time interval measured on the light clock. 

3. 
Answer : The round-trip time interval as measured on the earth will be smaller than the product of the Lorentz factor. 

4. 
Answer : The length will be 769 m. 


Lab 12. Polarization of Light

Introduction

     In this experiment, we observed the change in light intensity of light passing through crossed polarizing filter, which remove all but electric fields. This experiment focuses only on the electric field variation. We also measured the transmission of light through two polarizing filters as a function of the angle between their axes and compare it to Malus's Law.

Preliminary Questions

1. When one filter is at right angles to the other filter, anything can be seemed through both filters. 
2. When two filters' axes were parallel to each other, increasing of angle(0° - 180°) will give the increasing of transmitted light intensity. 

Procedure

PART 1. Two polarizers

Set two polarizers to be parallel to each others (0° & 0°), and rotate the second polarizer only with ~7.5° clockwise direction and measure the light intensity.

PART 2. Three Polarizer
Set first and third polarizers to be parallel to each others, and rotate the second polarizer by 7.5° clockwise direction and record the light intensity.

Data

PART 1.

PART 2. 
Discussion/Analysis

PART 1.
     1. 
2. 
3. 
4. When two polarizers were parallel to each other, the minimal lights were passing through. Therefore, the intensity would be minimal as well, which close to zero. Whereas, when two polarizers were perpendicular to each other, the maximal lights were passing through; which allowed maximum intensity. The measurement of part 1 started with perpendicular axis of two polarizer; so that it showed highest values of intensity. 

PART 2. 
1 & 2. 

3. 

Polarization upon Reflection
1. The light from the fluorescent bulb does not have any polarization. 

2. The reflected light have polarization. The light will be polarized in parallel plane. 


Sunday, May 26, 2013

Lab 14. Potential Energy Diagrams and Potential Wells

PART 1. Potential Energy Diagram

1. 
Answer : Range of motion will be between -5 and 5 cm 

2. 
Answer : The particle can not travel more than 5 cm from the origin because the particle doesn’t have enough energy to surpass the potential barrier.

3. 
Answer : Probability of detection is higher between -5 and 0 because the particle spends more time there (less kinetic energy).


4. 
Answer : E=1/2kx^x, 2E>sqrt2x

5 & 6. 
Answer 5: Kinetic energy vs. potential is an upside down parabola with vertex at x=0.
Answer 6: Most detected at extrema since kinetic energy is minimum.


PART 2. Potential Wells

1. 
Answer :